This data is compiled by FOCA from water samples taken by our Water Stewards over two decades. FOCA tracks many lakes in Ontario, and this analysis compares Miller Lake to similar lakes. We thank FOCA and our Stewards for their diligent work.
Lake Data Report for Miller Lake
General Information
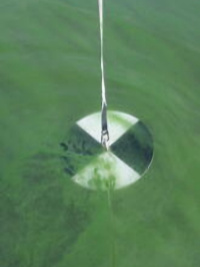
Miller Lake has been monitored by Lake Partners from 2002 to 2025. During this time, water samples were collected monthly for total phosphorus levels and water clarity. Water clarity is sampled using a Secchi disk. Calcium, chloride, and sulphate were included in the Lake Partner Program (LPP) in 2008 and 2015, respectively, and were sampled monthly along with total phosphorus.
Scope of the Lake Report
This report provides background information on Ontario's LPP, summarizes and provides analysis for each of the four water quality indicators monitored as part of the program (total phosphorus, calcium, chloride, sulphate, and water clarity), and provides information on how anyone can act as a steward for their lake.

Phosphorus
Miller Lake's phosphorus compared to other on-Shield lakes:
The average TP concentrations for Miller Lake between 2002 and 2025 is 9.6 ug/L. Miller Lake falls into the thirty-sixth percentile of TP concentrations in on-Shield lakes monitored by Lake Partner Program (LPP) volunteers.
This means that 64 percent of lakes have higher TP concentrations than Miller Lake.
The mean TP concentration of Miller Lake is below the Provincial Water Quality Objective of 20 ug/L. Algae blooms can still occur at total phosphorus levels below 20 ug/L.
Miller Lake's total phosphorus trends over time:
Miller Lake is a low production oligotrophic lake.
Between 2002 and 2025 phosphorus concentrations in Miller Lake had no significant statistical change. During this time TP concentrations fluctuated between 7.2 ug/L in 2015 to 14.1 ug/L in 2020.
Chloride
Miller Lake's comparison to other on-Shield lakes:
The average Cl concentration between 2015 and 2025 is 1.7 mg/L.
Miller Lake falls into the forty-seventh percentile of Cl concentrations in on-Shield lakes. This means that 53 percent of lakes have higher Cl concentrations than Miller Lake.
Miller Lake's chloride trends over time:
Between 2015 and 2025 Cl concentrations in Miller Lake had no significant statistical change. During this time Cl concentrations fluctuated between 1.6 mg/L in 2018 to 1.9 mg/L in 2022.
Calcium
Miller Lake's compared to other on-Shield lakes:
The average Ca concentration between 2009 and 2025 is 32.7 mg/L.
Miller Lake falls into the ninety-seventh percentile of Ca concentrations in on-Shield lakes. This means that 3 percent of lakes have higher Ca concentrations than Miller Lake.
Ca in Miller Lake is well above the threshold in which sensitive aquatic species may be at risk (1.5 mg/L).
Miller Lake's calcium trends over time:
Between 2009 and 2025 Ca concentrations in Miller Lake had no significant statistical change. During this time Ca concentrations fluctuated between 29.9 mg/L in 2023 to 35.8 mg/L in 2019.
Sulphates
Miller Lake's compared to other on-Shield lakes:
The average SO4 concentration between 2015 and 2025 is 3.0 mg/L.
Miller Lake falls into the forty-ninth percentile of SO4 concentrations in on-Shield lakes. This means that 51 percent of lakes have higher SO4 concentrations than Miller Lake.
SO4 in Miller Lake is well below provincal guidelines for very soft water lakes.
Miller Lake's sulphate trends over time:
Between 2015 and 2025 SO4 concentrations in Miller Lake had no significant statistical change. During this time SO4 concentrations fluctuated between 2.4 mg/L in 2019 to 4.3 mg/L in 2016.
Water Clarity
Miller Lake's water clarity compared to other on-Shield lakes:
The average Secchi depths between 2000 and 2025 is 2.0 m.
Miller Lake falls into the twelth percentile of Secchi depth on-Shield lakes in the LPP.
This means that 88 percent of lakes have higher Secchi depth's than Miller Lake.
Trends in Miller Lake's annual water clarity:
Between 2000 and 2025 water clarity levels in Miller Lake had no significant statistical change. During this time, water clarity levels fluctuated between 1.5 m in 2025 to 3.0 m in 2009.