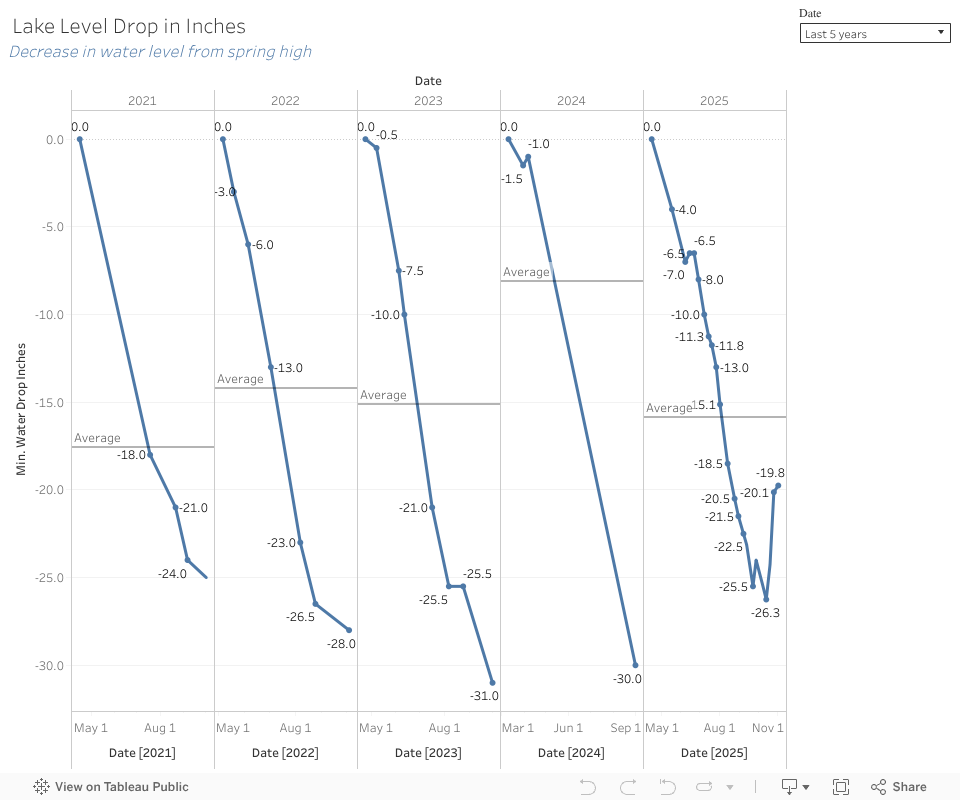
This chart, compiled by David L. White, compares the drop in yearly water levels over the course of 5 years. Many factors affect the volume of Miller Lake - precipitation, evaporation, natural springs in the lake bed, inflow from Britain Lake, outflow at the southwest end. As the charts indicate, repairs to the existing dam kept the water slightly higher in 2025.